Benchmark capital costs, analyze completion designs, and evaluate Lower 48 strategy using AFEs/Actuals from 100,000+ wells.
Trusted by operators across the Lower-48
From high-level benchmarking to detailed cost breakdowns, AFE Leaks gives you the data and tools to make informed decisions.
Compare well costs and performance across operators, regions, and time periods. Available with Basic subscription.
Advanced benchmarking with detailed component analysis and interactive visualizations.
Advanced economic analysis with type curve modeling, cash flow forecasting, and comprehensive financial metrics.
Build type curves from horizontal wells with production data. Run economics with PV-10/IRR on your forecasts.
Analyze revenue and GPT costs by lease and product for Texas, North Dakota, and New Mexico.
Compare realized oil & gas prices against WTI and Henry Hub benchmarks by operator, county, or state.
Track and analyze vendor costs across different service categories in the Permian Basin.
Filter and use existing operator costs to create average well templates with all components.
Access comprehensive SEC financial data by company with detailed filtering and export capabilities.
Comprehensive company analysis with financial ratios, performance metrics, and detailed company insights.
Both planned and actual costs
Daily data updates, not quarterly or annual
Filter, analyze, and export in real-time
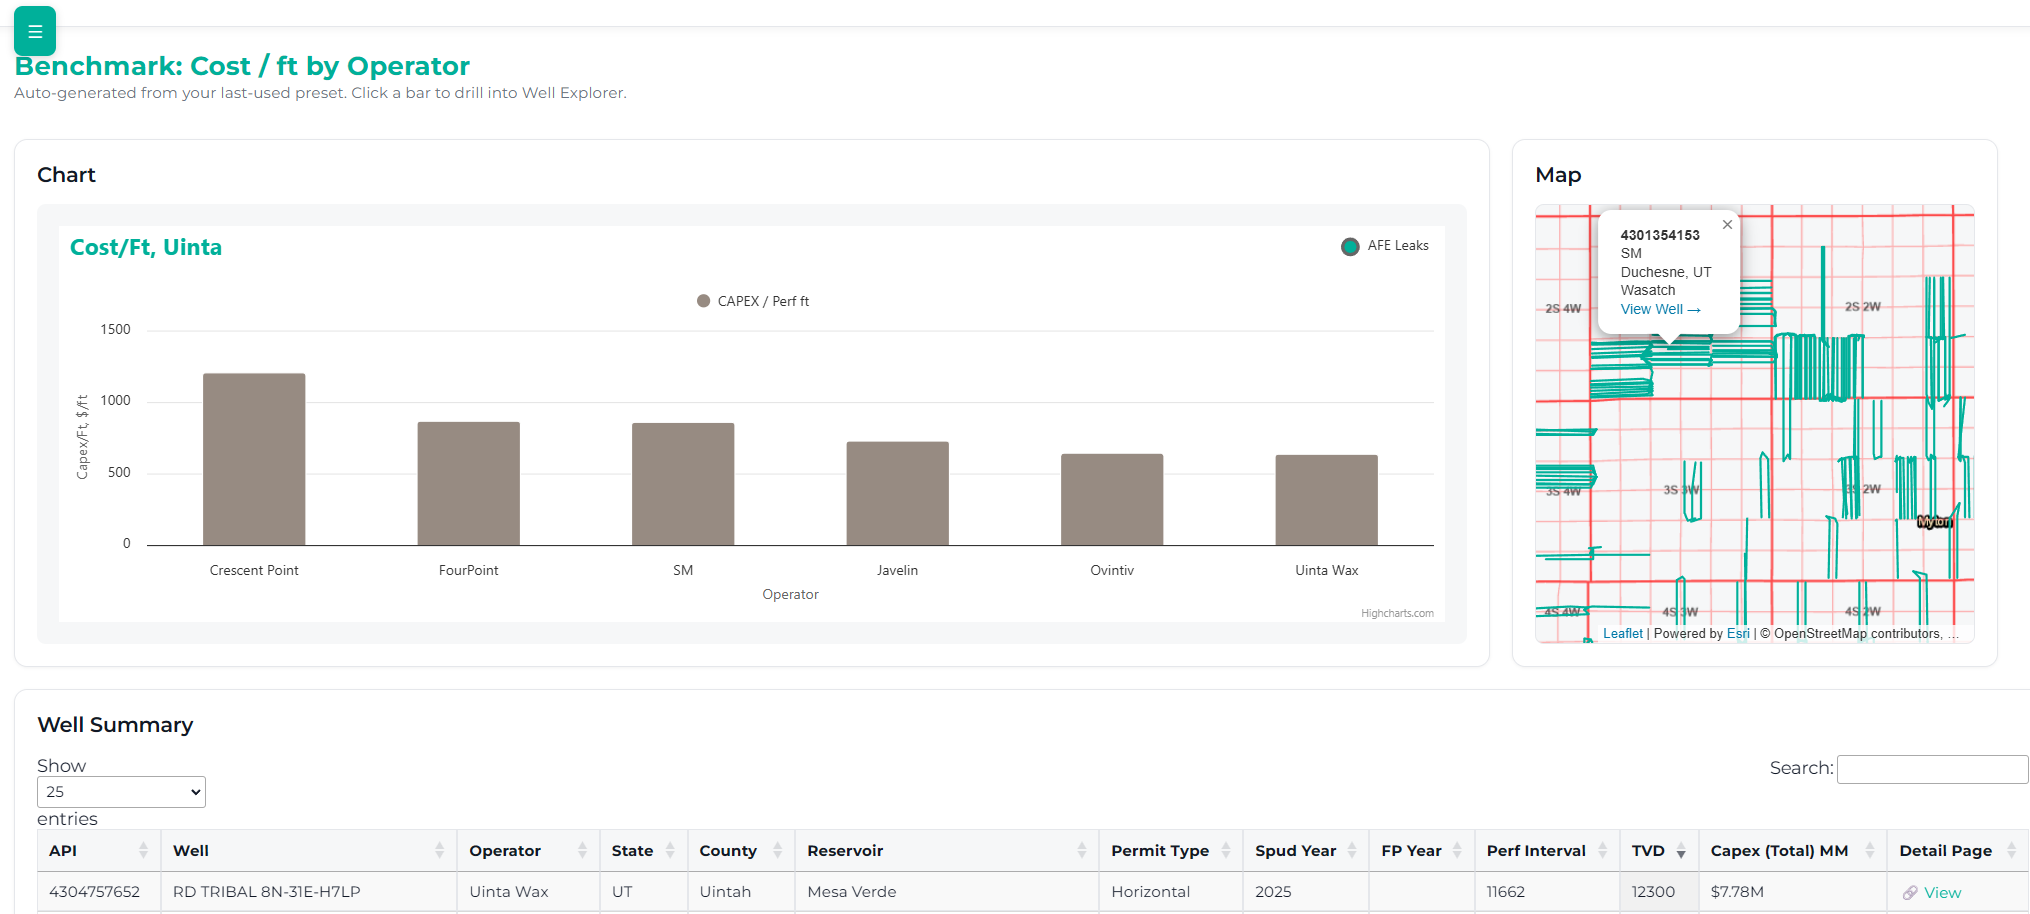
Interactive benchmarking with real-time cost comparisons and detailed analytics
Choose the plan that fits your needs
or $100/year
or $1000/year
Need data at scale, mass exports, or corporate features? Contact us for Corporate plans
Join operators across the Lower-48 who trust AFE Leaks for their cost benchmarking and analysis.